Solr Tuning

Recently we noticed that one of our Solr replica processes (a piece of software we use to power the search features)
was taking longer to respond to search queries than usual – enough to trigger a warning alert on our monitoring systems.
On first inspection, we saw that the machine was using a lot of memory – enough to go into swap space, but this was sitting around the same level as our other server, which was not experiencing problems.
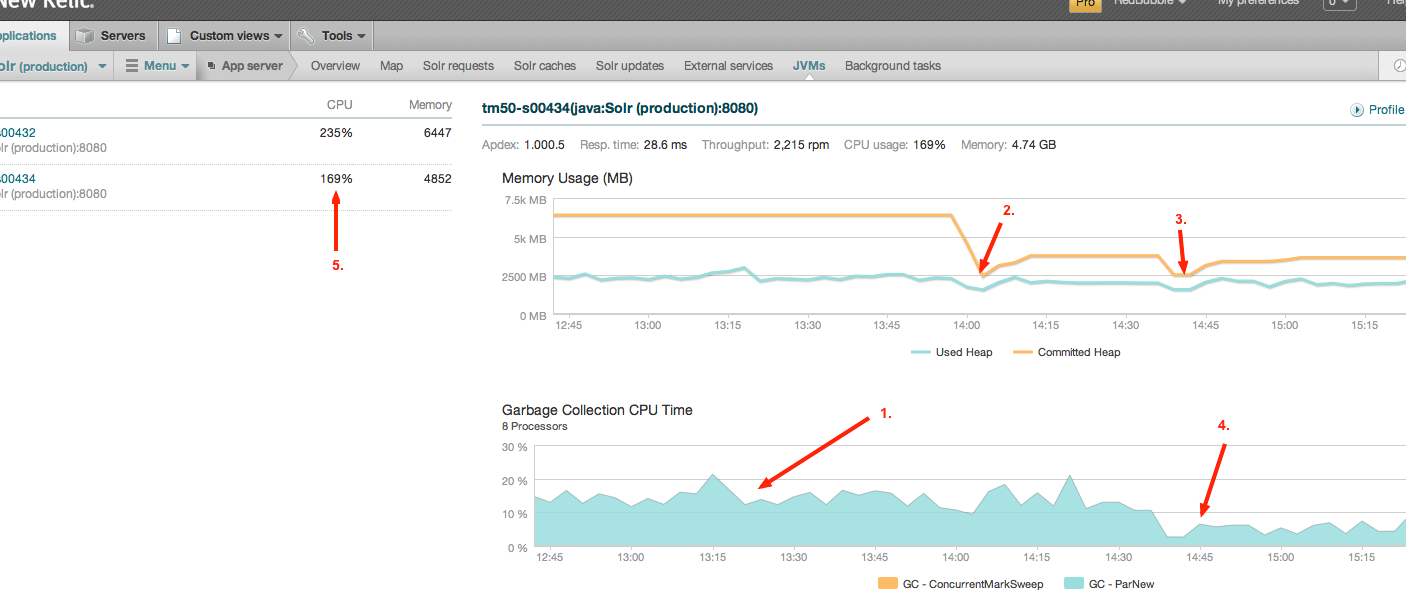
A little more digging, and we noticed, thanks to the JVM monitoring provided by NewRelic, that the Solr process was spending a lot of time (around 15% on average, but up to 50%) doing garbage collection. This means that 15% of the time, Solr is busy not answering search queries. Point (1) on the diagram shows this:

What we could see from our monitoring, most of the time was being spent doing “GC – ParNew”, which is when it is garbage collecting short-lived objects from memory. This makes sense given Solr’s usage pattern (build up a set of objects to return a search result, then discard them).
So how were we going to fix it? Before we could do that, we needed more insight into what was actually going on inside of the JVM.
We tried using JVisualVM, with the VisualGC plugin installed, to inspect how the garbage collection was behaving, but we found it incredibly difficult to get it connected to the remote machine via SSH tunnels. Luckily, the jstat command line
tool can provide much of the same information, albeit in a slightly harder to digest format.
First off, we need to find the java process identifier of the Tomcat process running Solr:
$ sudo jps
8645 Jps
22553 Bootstrap
Then we can start logging JVM statistics – this command prints GC stats and utilization (more info detailed here):
$ sudo jstat -gcutil 22553 500ms
S0 S1 E O P YGC YGCT FGC FGCT GCT
22.16 0.00 11.23 37.94 58.91 45005898 927897.243 59212 1614.041 929511.283
51.80 0.00 14.36 38.03 58.91 45005902 927897.330 59212 1614.041 929511.370
0.00 83.35 0.00 38.16 58.91 45005909 927897.461 59212 1614.041 929511.502
0.00 56.20 0.00 38.24 58.91 45005913 927897.541 59212 1614.041 929511.582
81.74 0.00 25.85 38.25 58.91 45005917 927897.595 59212 1614.041 929511.636
0.00 98.13 0.00 38.35 58.91 45005921 927897.704 59212 1614.041 929511.745
0.00 37.73 70.60 38.49 58.91 45005925 927897.781 59212 1614.041 929511.821
0.00 100.00 45.11 38.57 58.91 45005929 927897.862 59212 1614.041 929511.903
… etc, etc …
We logged a much larger set of data, but I’ve trimmed it here. From this data, we could see some patterns emerging, but first, a quick explanation on the different types of heap memory in the Java VM:
Eden space: This is the block of memory where brand new objects are created in, and the first area that get collected.
Any objects that were in Eden, and are still in use, then get moved into either S0 or S1.
Survivor (S0 or S1) space: These are two areas, typically much smaller than Eden, where objects live before they either
get collected, or ‘promoted’ to OldGen. This happens less frequently than the Eden collection, and objects can live in Survivor
space for a few collections before being sent to OldGen.
Old Generation (OldGen): This is the ‘main’ heap. Long lived objects will eventually end up in here, and when this
approaches being full, it will also be collected. Collections in this space tend to be much slower than in the other areas.
From our data, we could see that 99.7% of the time that the JVM was spending doing garbage collection, was in Eden/S0/S1. We could also see that Eden was filling up and emptying very rapidly (around every 5-10 seconds or so).
As a first step, we added the -XX:NewSize=128M -XX:MaxNewSize=128M JVM options to the Tomcat server that was running Solr, increasing it from the 40MB. We also set -XX:SurvivorRatio=4 , to increase the relative size of the S0 and S1.
For reference, our max heap is set at 6.4GB, and we’re using -X:UseConcMarkSweepGC on jdk 1.6.0.26.
When we restarted Solr (point 2 on the chart), we saw the expected initial memory usage drop, but the GC time was remained much the same as it was. After some further digging, we came across this post, which listed a a few extra tuning parameters.
After applying -XX:+UseCompressedOops -XX:+UseStringCache -XX:+OptimizeStringConcat -XX:+UseCompressedStrings -XX:CMSInitiatingOccupancyFraction=75 -XX:+CMSParallelRemarkEnabled in addition to the other tweaks, and restarted (3), we saw a marked reduction in garbage collection time (4).
Overall, CPU usage for the Solr node was also down (5), and the max allocated heap has settled in at around 5GB, which is down from what we were seeing before. Overall, this change will have bought us some extra headroom on our Solr replicas, thus delaying the point at which we will have to add an extra one.