Measuring a few things with statsd

A little while ago, we realised that at having information about what was happening on the site right now would be useful for many things; including tracking and alerting us to the sorts of issues that wouldn’t necessarily
be caught by more traditional means (such as Airbrake alerting).
Having come across this post by Etsy, we looked at statsd as a way to collect this information in a quick way without adding much processing overhead.
Essentially the statsd daemon runs on a host (or number of hosts, and you can push all sorts of data directly to it, via a UDP port (so it’s extra fast). We then had statsd periodically (e.g. every 5 minutes) push it’s aggregated data out to Circonus, which can graph and alert based on that data.
Calls from ruby code are extremely simple, for example:
StatsdClient.increment("Some interesting counter")What if you want to monitor something, and don’t even want to start up a Rails environment to do it? We use RabbitMQ as a messaging system between some of the components here, and we wanted to graph the message levels of
several queues we have set up. To do this, we wrote a simple bash script:
#!/bin/bash

queues=("queue.widgets" "queue.frobbles" "queue.gizmos")
DATA=`sudo rabbitmqctl list_queues`
STATS=""
for queue in "${queues[@]}"
do
  GUAGE=`echo "$DATA" | grep ${queue} | awk '{print $2}'`
  STATS="$STATS${queue}:$GUAGE|g"$'\n'
done

echo "$STATS" | nc -w 1 -u statsd.hostname.com 8125
The queue names have been changed to protect the innocent…
What this script does is take the output of the rabbitmqctl command:
Listing queues ...
queue.widgets 1
queue.frobbles 3
queue.gizmos 0
and uses grep and awk to convert it into a format statsd understands:
queue.widgets:1|g
queue.frobbles:3|g
queue.gizmos:0|g
which we then just use netcat (nc) to push this to UDP port 8125, where statsd is listening. This script can be run via a cronjob regularly, say, every minute, with very little overhead or startup time.
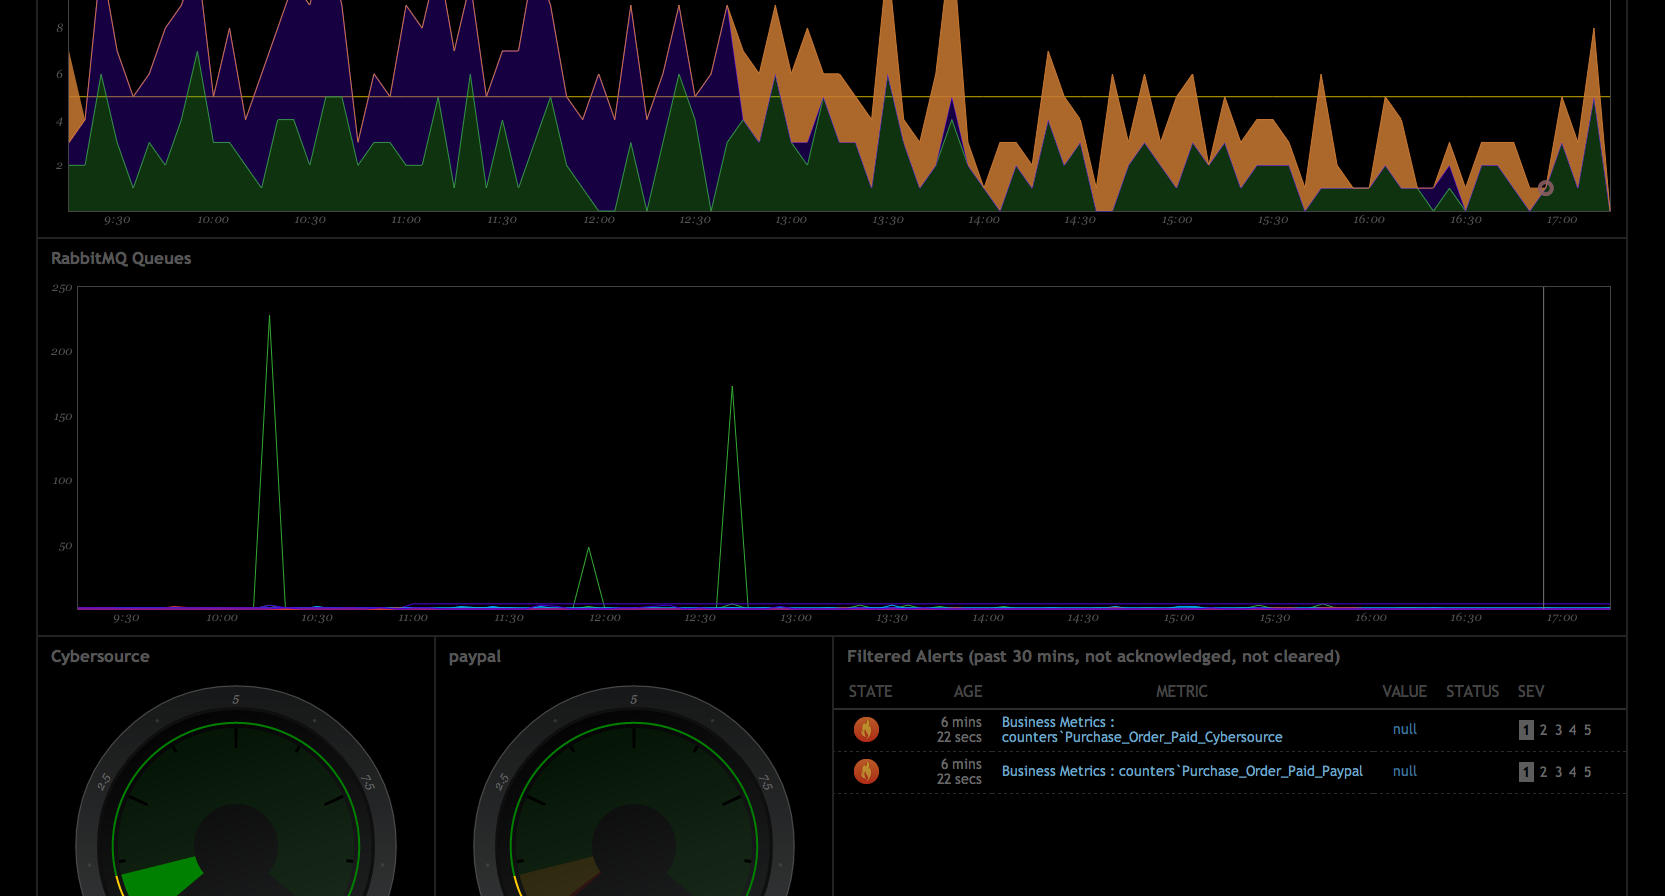
Without needing to do any more configuration, these counters start to show up in Circonus, and we can then show graphs of the data:

Easy!