Discovering Ruby 1.9.3 YAML parser performance

This is a tale of one of those times where it is actually useful to do code profiling and benchmarking. A bit of background: We’ve been in the process of upgrading our Ruby on Rails stack, going from Rails 2.3 to 3.0, with an eye to moving forward to 3.2. Through this, to minimise the amount of change happening at once, we’ve stuck with Ruby 1.8.7, instead of jumping right to 1.9.3.
When we rolled out Rails 3, we noticed a significant slowdown in the general performance of the site, even though the benchmarks we had run at the time indicated that it should be okay. It has been widely reported that Ruby 1.9.3 has in
general, far greater performance than 1.8.7, and we wanted to know if moving to the newer language version would bring us the sorts of performance improvements we were looking for.
Clearly some more investigation was required. We chose one of the slower pages on the site; the shop page (e.g http://redbubble.com/shop/recent+t-shirts) accounts for 47% of all the processing time on the site. This is due
to it’s complexity – it displays multiple “configured” products, multiple images with links, uses solr to return results from the search terms, hits the database, and renders several partials with fairly complex markup.

First, we wanted to establish some baseline numbers, so we used Siege (http://www.joedog.org/siege-home/)
to hit the page 1000 times, and return some data about how it performed.
Test Methodology:
- We would set up each environment (ruby/rails combination), bring in code fixes from a branch (for ruby 1.9 compatibility when required), do an rvm use ruby-x.x.x to switch versions, and run bundler to make sure we were running the right gems.
- Modify config/environments/development.rb to turn on the class caching, like would be used in production:
config.cache_classes = true
config.action_controller.perform_caching = true- run
bundle exec unicorn_rails 2> /dev/nullto run the site via unicorn on port 8080 - Load up
http://localhost:8080/shop/recent+t-shirtsonce, to make sure the page loads, and shows the same content as we expect - Warm up the server by using Siege to hit it 100 times:
siege -c 1 -b -r 100 "http://localhost:8080/shop/recent+t-shirts" - Run the benchmark using Siege, set to use one ‘concurrent’ user, and no waiting between requests:
siege -c 1 -b -r 100 "http://localhost:8080/shop/recent+t-shirts" - Record the results.
What we ended up with was rather telling:
|
1 2 3 4 5 |
Environment Requests/s Response Time Ruby 1.8.7 + Rails 3.0 3.94 0.25 Ruby 1.9.3 + Rails 3.0 4.29 0.23 Ruby 1.8.7 + Rails 3.2 2.46 0.41 Ruby 1.9.3 + Rails 3.2 1.63 0.61 |
From these results, we could see that Ruby 1.9.3 was marginally better than 1.8.7, on the Rails 3.0 codebase, but confusingly, much, much slower for 3.2 (and that 3.2 in general was a ton slower than 3.0). Something was amis.
After installing the ruby profiling gem (http://rubygems.org/gems/ruby-prof) we could then run some benchmarks within the rails console.
First off, we did some coarse-grained testing to try and find roughly the spots in the code that were slow, and narrowing it down from there. So starting at e.g. (the 3rd number is the sum of the user and system CPU times):
puts Benchmark.measure{ 10.times{ app.get '/shop/recent+t-shirts' } }

=> 23.870000 0.440000 24.310000 ( 24.658007)
through to e.g.:
puts Benchmark.measure{ 5000.times{ ImageWork.first.product_by_class(TShirtProduct).build_valid_configured_product } }

=> 13.630000 0.150000 13.780000 ( 14.807684)
through to finding the actually slow part1
puts Benchmark.measure{ 5000.times{ p=ImageWork.first.product_by_class(TShirtProduct); p.option_values } }

=> 7.520000 0.120000 7.640000 ( 8.537715)
1 We’d managed to eliminate the ActiveRecord find and the product_by_class method early on in the process
Now that we had our culprit, we needed to know exactly why it was so poor. For this we used the profiling feature of ruby-prof, to provide a breakdown if just how much time was being spent doing what in this piece of code.
Again, in the rails console, we can do this:
#This turns off log printing
ActiveRecord::Base.logger = Rails.logger = Logger.new('/dev/null')

result = RubyProf.profile do
  5000.times {p=ImageWork.first.product_by_class(TShirtProduct); p.option_values}
end

File.open('profile.html', 'w') do |f|
  RubyProf::GraphHtmlPrinter.new(result).print(f)
end
This writes the result of the profiling run to an easy(ish) HTML file to look at and analyse.
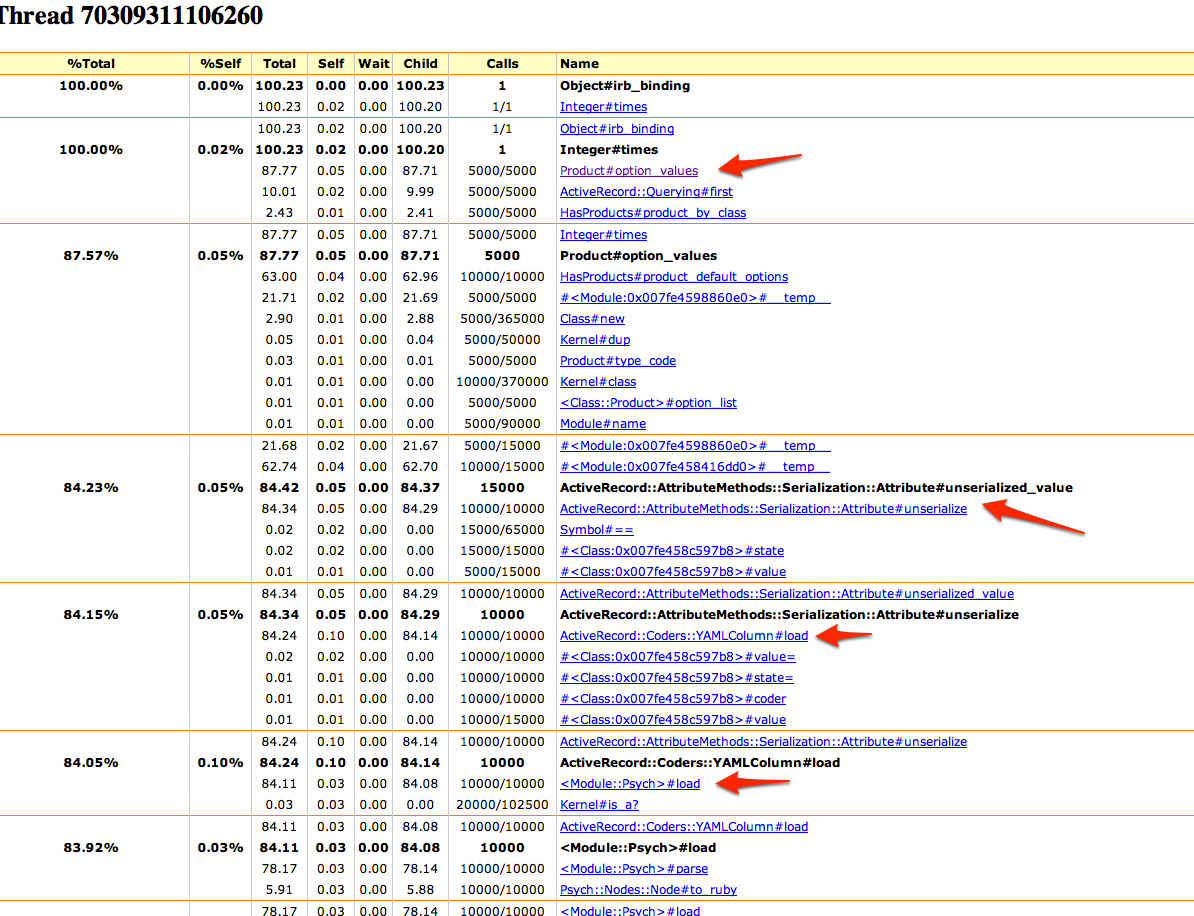
From the 1.9.3 profiled run, we can see that a huge amount of time is being spent in YAML deserialization. We store some product properties in the database in YAML form (ironically enough, for speed reasons), which is why this is happening here.

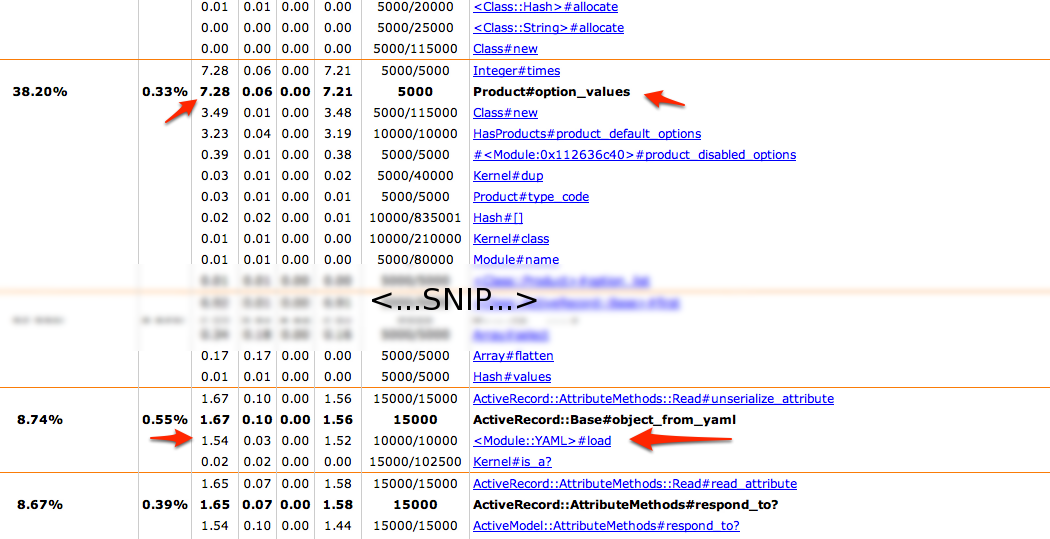
Compared to the same code running on Ruby 1.8.7, #option_values only takes up 7.2 seconds of run-time, and only 1.5 seconds doing YAML loading, compared to 100 seconds and 84 seconds on 1.9.3.

We did some digging, and it turns out that in Ruby 1.9, the default YAML parser has been changed from ‘syck’ to ‘psych’, which is implemented in pure Ruby, rather than in C. Luckily for us, it is possible to get ruby to use the old parser by adding this line to the environment config file:
YAML::ENGINE.yamler = 'syck'
Once we made this change and ran the benchmarks again, we saw the #option_values time drop to a value even lower than the 1.8 code – a good result!

We could then run our siege benchmarks again, and the result was dramatic:
|
1 2 3 4 5 |
Environment Requests/s Response Time Ruby 1.9.3 with syck + Rails 3.0 7.35 0.14 Ruby 1.8.7 + Rails 3.0 3.94 0.25 Ruby 1.9.3 + Rails 3.0 4.29 0.23 Ruby 1.9.3 with syck + Rails 3.2 3.58 0.28 |
This is over a 70% speed increase in response rate over 1.9.3, and even more over the 1.8.7 code.
We also tested (as you can see in the last row) 1.9.3 with the old syck parser on Rails 3.2, which although significantly faster than the new parser, is still quite slow. This still remains unexplained, and will be the subject of our next investigation…